
Explore the Stellar Life Cycle & H-R Diagram Simulator
Build a star by mass and watch it evolve on the Hertzsprung-Russell diagram from the main sequence to its final fate. Works on phones and computers.
- Free to use
- No signup
- Nothing to install
- Runs in your browser
Illustration. Open the tool for the real thing.
See it in action
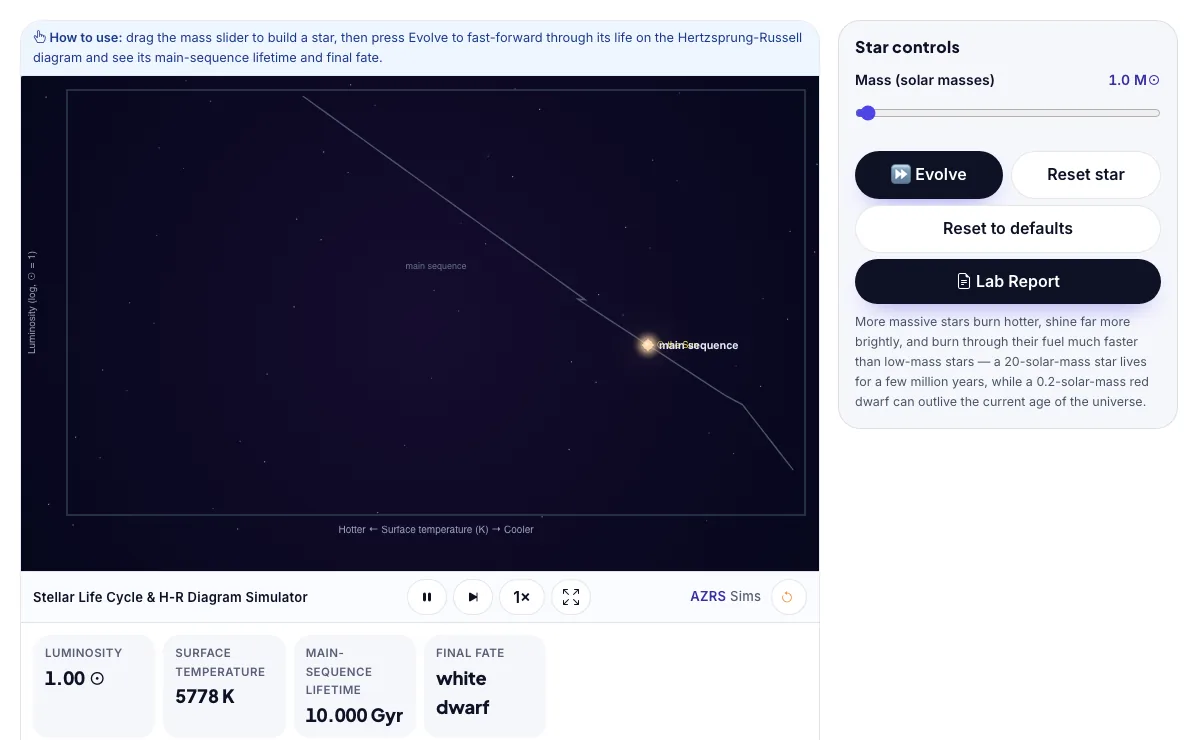
The Stellar Life Cycle & H-R Diagram Simulator with sample data entered and the result showing.
What is the Stellar Life Cycle & H-R Diagram Simulator?
Build a star by mass and watch it evolve on the Hertzsprung-Russell diagram from the main sequence to its final fate. It runs in your browser, so a change to a setting or a drag on an object shows up at once.
Astronomers use exactly this mass-luminosity-lifetime relationship, calibrated against real H-R diagrams of star clusters, to estimate a cluster's age from where its stars have started peeling off the main sequence.
3 steps to your result
Open the tool and follow along. Nothing to install.
What you get
A star's mass sets almost everything about it: luminosity scales roughly as L ∝ M^3.5, so a small mass difference means a huge brightness difference.
Main-sequence lifetime scales as t ∝ M / L ∝ M^-2.5, so massive stars burn hot, bright and fast while low-mass red dwarfs sip their fuel for trillions of years.
On the H-R diagram, hot blue stars sit on the upper left and cool red stars on the lower right; most stars, for most of their lives, sit on the main-sequence band running from upper left to lower right.
Set the mass to 20 solar masses and evolve - watch how fast it races through its life.
Set the mass to 0.3 solar masses and compare its lifetime to the Sun's.
Evolve a 1 solar mass star and watch it become a red giant before ending as a white dwarf.
Used for
Pick one to see how it fits.
Teachers
For teachers: project the Stellar Life Cycle & H-R Diagram Simulator on the board, let students predict the result, then run it together and test this: Set the mass to 0.3 solar masses and compare its lifetime to the Sun's. For students: change one thing at a time and write down what changes.
Try it freeHow it compares
A plain look at this tool next to the usual alternative.
| This simulation | Textbook diagram | |
|---|---|---|
| Interactive | Drag, tap and change settings | Fixed picture |
| Install | Nothing to install | Not needed |
| Cost | Free to use | Depends on the book |
Questions people ask
Why do the most massive stars have the shortest lives despite having the most fuel?
Luminosity grows much faster than mass (L ∝ M^3.5), so a massive star burns its larger fuel supply at a hugely disproportionate rate, and the burn rate wins - net lifetime falls as mass rises.
Why does our Sun's fate differ from a star 15 times more massive?
The Sun, at 1 solar mass, lacks the core mass needed to fuse elements beyond helium under high enough pressure, so it sheds its outer layers as a planetary nebula and leaves a white dwarf; a 15-solar-mass star has enough core mass to fuse all the way to iron and then collapses catastrophically in a supernova, leaving a neutron star.
Is the Stellar Life Cycle & H-R Diagram Simulator free to use?
Yes. The Stellar Life Cycle & H-R Diagram Simulator is free, needs no signup or download and runs in your web browser. It is part of the Astronomy group of AZRS simulations.
Does the Stellar Life Cycle & H-R Diagram Simulator work on a phone or tablet?
Yes. The Stellar Life Cycle & H-R Diagram Simulator takes touch input as well as mouse input, so you can use its 1 adjustable settings with a finger. A larger screen makes the controls and graphs easier to read.
How do I use the Stellar Life Cycle & H-R Diagram Simulator?
1. In the Stellar Life Cycle & H-R Diagram Simulator, use the controls to change Mass (solar masses). The simulation reacts instantly. 2. In the Stellar Life Cycle & H-R Diagram Simulator, press "⏩ Evolve", "Reset star" to start, reset or change what is happening. 3. Start with this experiment: Set the mass to 20 solar masses and evolve - watch how fast it races through its life. Drag any glowing handle, object or slider with your mouse or finger and the Stellar Life Cycle & H-R Diagram Simulator responds in real time. 4. Change one setting at a time and watch which readout moves, then compare it with this idea: A star's mass sets almost everything about it: luminosity scales roughly as L ∝ M^3.5, so a small mass difference means a huge brightness difference.
More free tools
Related to the Stellar Life Cycle & H-R Diagram Simulator.
Try the Stellar Life Cycle & H-R Diagram Simulator now
Build a star by mass and watch it evolve on the Hertzsprung-Russell diagram from the main. Free to use.
Try it free