Enthalpy & Activation Energy Diagram
Drag the reactant, peak and product levels of an energy profile and see ΔH, Ea and the effect of a catalyst.
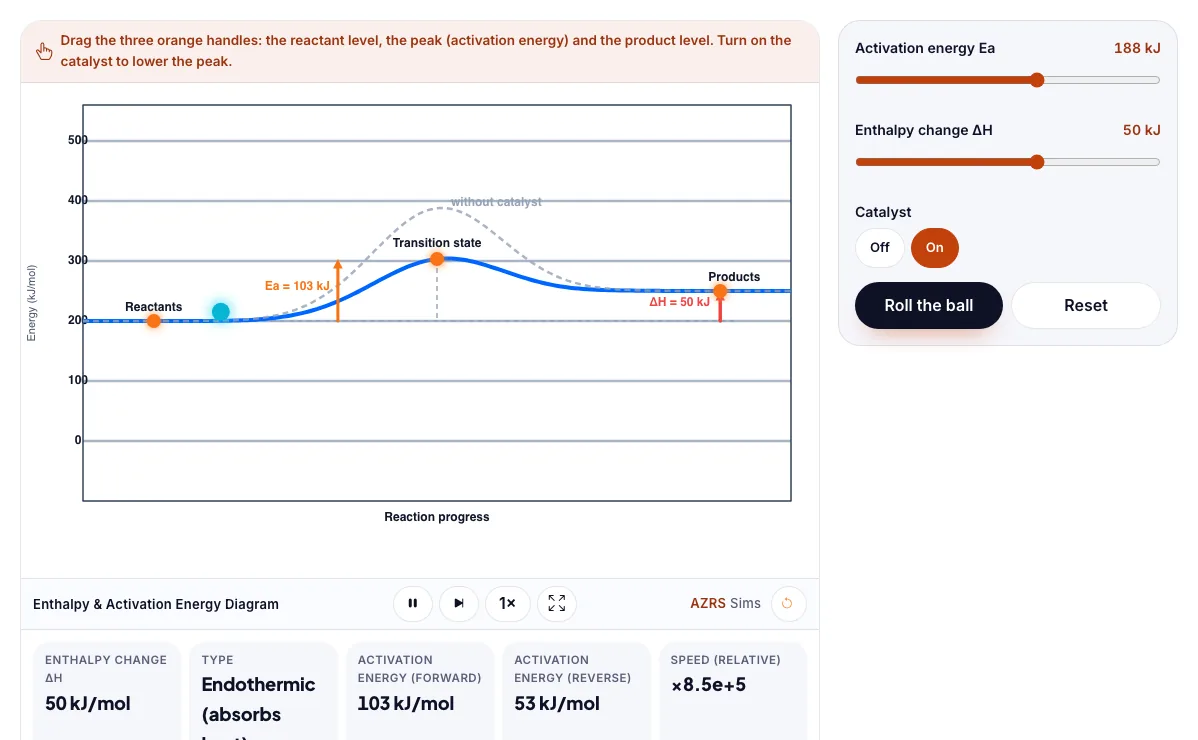
Drag the three orange handles: the reactant level, the peak (activation energy) and the product level. Turn on the catalyst to lower the peak.
What the Enthalpy & Activation Energy Diagram shows
Drag the reactant, peak and product levels of an energy profile and see ΔH, Ea and the effect of a catalyst. Free, no signup, runs in your browser. Built for reactions & kinetics, the enthalpy & activation energy diagram runs instantly in your browser: change a setting or drag an object and the result updates at once, so you learn by trying things out rather than only reading about them.
Drag the reactant, peak and product levels of an energy diagram to see delta H and Ea.
How to use the Enthalpy & Activation Energy Diagram
In the Enthalpy & Activation Energy Diagram, use the controls to change Activation energy Ea, Enthalpy change ΔH, Catalyst. The simulation reacts instantly.
In the Enthalpy & Activation Energy Diagram, pick an option such as Off, On to switch modes or load an example.
In the Enthalpy & Activation Energy Diagram, press "Roll the ball", "Reset" to start, reset or change what is happening.
Start with this experiment: Make ΔH negative, then positive. Drag any glowing handle, object or slider with your mouse or finger and the Enthalpy & Activation Energy Diagram responds in real time.
Change one setting at a time and watch which readout moves, then compare it with this idea: ΔH is the energy of the products minus the energy of the reactants.
Things to try
Make ΔH negative, then positive.
Drag the peak up and roll the ball.
Turn the catalyst on and compare Ea.
Set ΔH near zero and see the reaction is thermoneutral.
The science behind it
ΔH is the energy of the products minus the energy of the reactants.
Negative ΔH is exothermic; positive ΔH is endothermic.
Activation energy is the height of the barrier the reaction must climb.
A catalyst lowers the barrier for both directions but does not change ΔH.
A worked example with real numbers
Ea = 70 kJ
delta H = -30 kJ (exothermic)
Reverse Ea = 100 kJ
Tips and common mistakes
Tips
- Raise the product level to make an endothermic reaction.
- Add a catalyst and see the peak drop.
Common mistakes
- Reading delta H from the peak.
- Mixing up forward and reverse Ea.
Where this is used
Industrial catalysts, hand warmers, cold packs, rocket fuels and the design of every chemical plant depend on energy profiles.
Who is this simulation for?
Students learning reaction rates, equilibrium and equations, and teachers who want a visual way to explain what happens to particles. A good first experiment in the Enthalpy & Activation Energy Diagram: Make ΔH negative, then positive. The key relation to keep an eye on: delta H = H_products - H_reactants; Ea = H_peak - H_reactants.
For teachers: project the Enthalpy & Activation Energy Diagram on the board, let students predict the result, then run it together and test this: Drag the peak up and roll the ball. For students: change one thing at a time and write down what changes.
Frequently asked questions
What is activation energy?
The minimum energy that colliding particles need to react, shown as the height from reactants to the peak.
Does a catalyst change ΔH?
No. It only lowers the activation energy, so the reaction is faster but releases or absorbs the same heat.
Is the Enthalpy & Activation Energy Diagram free to use?
Yes. The Enthalpy & Activation Energy Diagram is free, needs no signup or download and runs in your web browser. It is part of the Reactions & Kinetics group of AZRS simulations.
Does the Enthalpy & Activation Energy Diagram work on a phone or tablet?
Yes. The Enthalpy & Activation Energy Diagram takes touch input as well as mouse input, so you can use its 3 adjustable settings with a finger. A larger screen makes the controls and graphs easier to read.