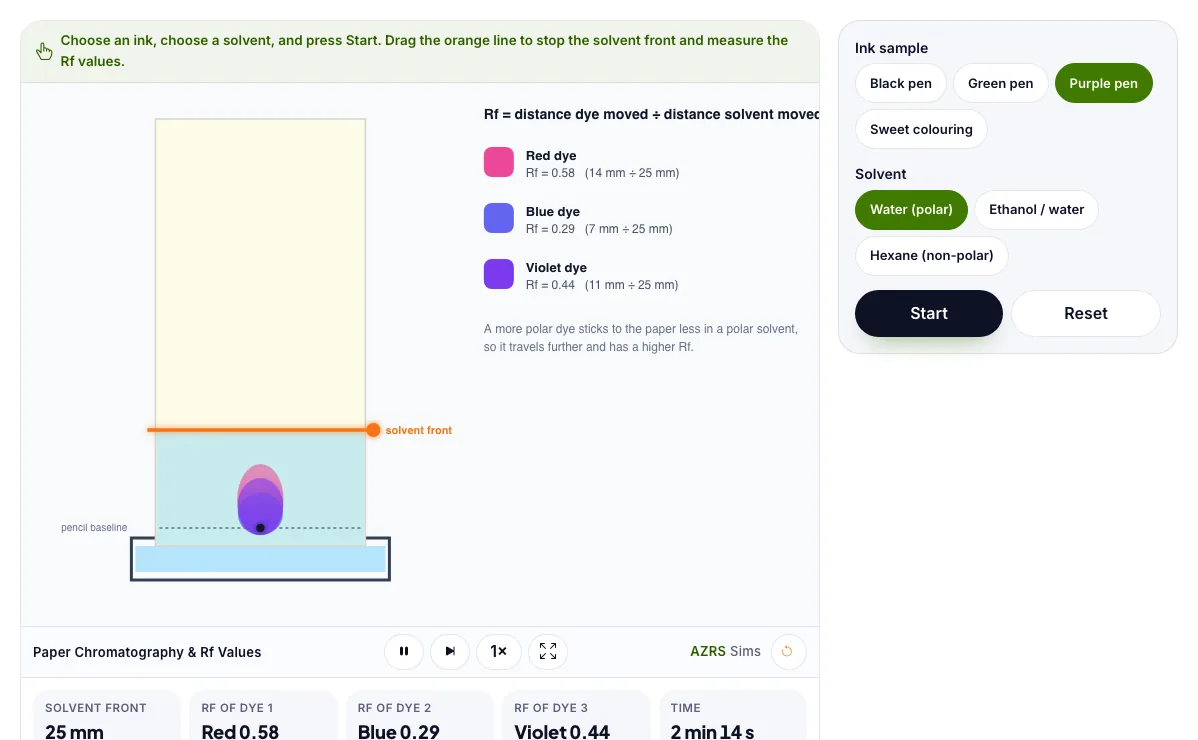
Paper Chromatography & Rf Values
Separate the dyes of an ink on paper, choose the solvent and measure the Rf value of each dye.
Choose an ink, choose a solvent, and press Start. Drag the orange line to stop the solvent front and measure the Rf values.
What the Paper Chromatography & Rf Values shows
Separate the dyes of an ink on paper, choose the solvent and measure the Rf value of each dye. Free, no signup, runs in your browser. Built for chemistry labs, the paper chromatography & rf values runs instantly in your browser: change a setting or drag an object and the result updates at once, so you learn by trying things out rather than only reading about them.
A pen ink spotted on paper separates as a solvent rises. You read the distance each colour travels.
How to use the Paper Chromatography & Rf Values
In the Paper Chromatography & Rf Values, use the controls to change Ink sample, Solvent. The simulation reacts instantly.
In the Paper Chromatography & Rf Values, pick an option such as Black pen, Green pen, Purple pen, Sweet colouring to switch modes or load an example.
In the Paper Chromatography & Rf Values, press "Start", "Reset" to start, reset or change what is happening.
Start with this experiment: Separate the black pen in water. Drag any glowing handle, object or slider with your mouse or finger and the Paper Chromatography & Rf Values responds in real time.
Change one setting at a time and watch which readout moves, then compare it with this idea: A solvent rises through paper and carries the dyes with it.
Things to try
Separate the black pen in water.
Change to ethanol and compare the Rf values.
Drag the solvent front halfway and confirm the Rf stays the same.
The science behind it
A solvent rises through paper and carries the dyes with it.
Rf = distance moved by dye ÷ distance moved by solvent.
Different dyes stick to the paper by different amounts.
The solvent changes how far each dye travels.
A worked example with real numbers
Rf = 3.6 / 6.0 = 0.60
A higher Rf means the pigment is more soluble in the solvent than it is attracted to the paper.
Tips and common mistakes
Tips
- Compare black, green and purple pens: which has the most pigments?
- Change the solvent and see Rf change.
- Compute Rf for each spot.
Common mistakes
- Draw the start line in pencil, since pen ink would run.
- Rf is never greater than 1.
- Measure to the centre of each spot.
Where this is used
Forensic scientists analyse inks and drugs, food companies test colourings and doctors analyse blood and urine with chromatography.
Who is this simulation for?
Students preparing for practical exams and teachers who want a virtual lab. A good first experiment in the Paper Chromatography & Rf Values: Separate the black pen in water. The key relation to keep an eye on: Rf = distance moved by the spot / distance moved by the solvent front.
For teachers: project the Paper Chromatography & Rf Values on the board, let students predict the result, then run it together and test this: Change to ethanol and compare the Rf values. For students: change one thing at a time and write down what changes.
Frequently asked questions
What is an Rf value?
The ratio of the distance travelled by a substance to the distance travelled by the solvent front. It is always between 0 and 1.
Why must the baseline be drawn in pencil?
Pencil does not dissolve in the solvent, but ink would run and spoil the result.
Is the Paper Chromatography & Rf Values free to use?
Yes. The Paper Chromatography & Rf Values is free, needs no signup or download and runs in your web browser. It is part of the Chemistry Labs group of AZRS simulations.
Does the Paper Chromatography & Rf Values work on a phone or tablet?
Yes. The Paper Chromatography & Rf Values takes touch input as well as mouse input, so you can use its 2 adjustable settings with a finger. A larger screen makes the controls and graphs easier to read.