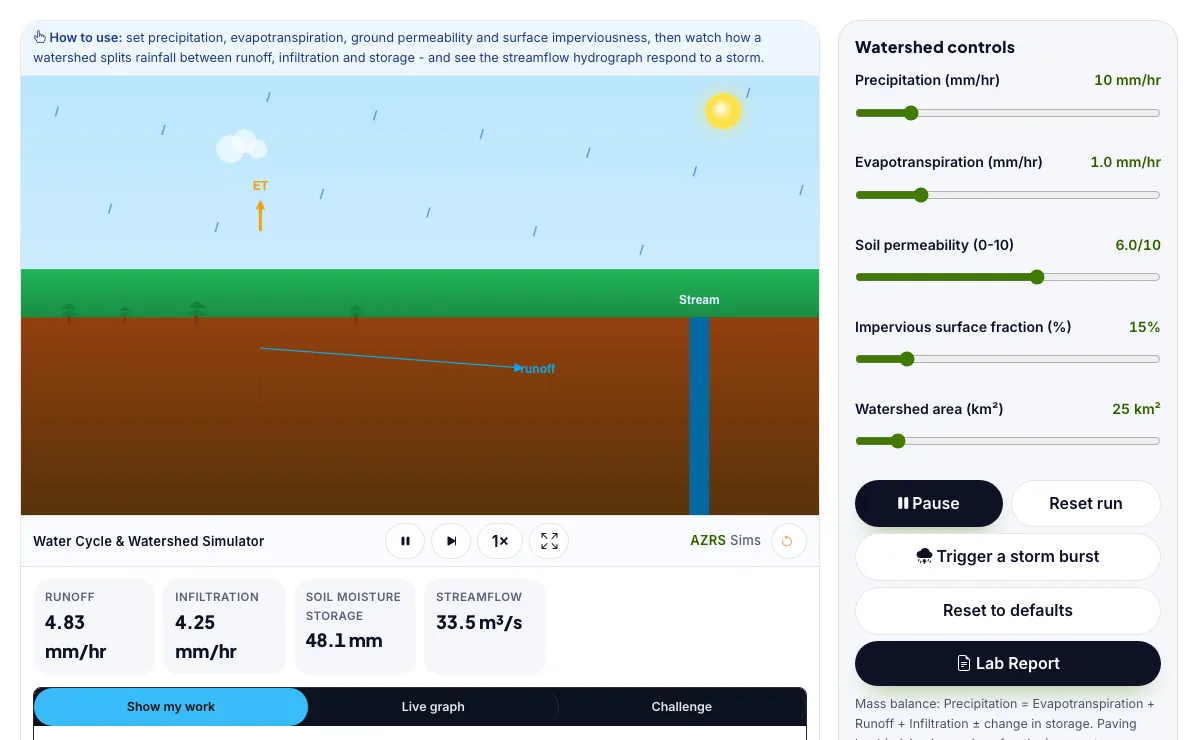
Water Cycle & Watershed Simulator
Set rainfall, evapotranspiration and land cover and watch a real mass-balance model split water between runoff, infiltration and storage, with a live streamflow hydrograph.
How to use: set precipitation, evapotranspiration, ground permeability and surface imperviousness, then watch how a watershed splits rainfall between runoff, infiltration and storage - and see the streamflow hydrograph respond to a storm.
Challenge 1: balance the budget
Tune the sliders so precipitation ≈ evapotranspiration + runoff + infiltration (mass balance within 5%), keeping storage roughly steady.
Challenge 2: trigger a flash flood
Raise the impervious surface fraction and rainfall so peak streamflow exceeds 80 m³/s - simulating urban flash flooding.
What the Water Cycle & Watershed Simulator shows
Set rainfall, evapotranspiration and land cover and watch a real mass-balance model split water between runoff, infiltration and storage. Built for environmental science, the water cycle & watershed simulator runs instantly in your browser: change a setting or drag an object and the result updates at once, so you learn by trying things out rather than only reading about them.
Rain on a watershed splits into evaporation, infiltration and runoff, depending on soil and paving.
How to use the Water Cycle & Watershed Simulator
In the Water Cycle & Watershed Simulator, use the controls to change Precipitation (mm/hr), Evapotranspiration (mm/hr), Soil permeability (0-10), Impervious surface fraction (%), Watershed area (km²). The simulation reacts instantly.
In the Water Cycle & Watershed Simulator, press "▶ Run", "Reset run", "Trigger a storm burst" to start, reset or change what is happening.
Start with this experiment: Set impervious surface to 80% and rainfall to 40 mm/hr, then watch the hydrograph spike. Drag any glowing handle, object or slider with your mouse or finger and the Water Cycle & Watershed Simulator responds in real time.
Change one setting at a time and watch which readout moves, then compare it with this idea: The full water cycle mass balance is: Precipitation = Evapotranspiration + Runoff + Infiltration ± change in storage.
Things to try
Set impervious surface to 80% and rainfall to 40 mm/hr, then watch the hydrograph spike.
Compare the same rainfall on high permeability, 0% impervious land versus low permeability, 60% impervious land.
Try to balance precipitation against ET+runoff+infiltration exactly.
Shrink the watershed area and see how much streamflow drops for the same runoff depth.
The science behind it
The full water cycle mass balance is: Precipitation = Evapotranspiration + Runoff + Infiltration ± change in storage.
How much rain becomes runoff versus infiltration depends heavily on land cover: permeable soil and vegetation soak up much more water, while paved or compacted surfaces send nearly all of it straight to runoff.
Streamflow discharge equals the runoff depth multiplied by the watershed's drainage area, so the same storm produces far more streamflow over a large watershed than a small one.
A hydrograph - streamflow plotted over time - rises quickly and peaks higher when a watershed is more paved (impervious), which is the physical basis of urban flash flooding.
A worked example with real numbers
Q = 0.278 × 0.3 × 20 × 50 = 83 m³/s
Paving raises C toward 0.9, so Q would be about 250 m³/s.
Same rain, a much higher flood peak.
Tips and common mistakes
Tips
- Increase impervious surface and watch runoff rise.
- Trigger a storm burst.
- Change permeability.
Common mistakes
- Runoff is not just rainfall; soil absorbs some.
- Evaporation is part of the cycle.
- Rain intensity matters as well as total rain.
Where this is used
Civil engineers size storm drains and floodplain maps using exactly this kind of runoff-versus-infiltration and hydrograph modeling, especially when urban development changes a watershed's impervious surface fraction.
Who is this simulation for?
Students, teachers and curious learners of all ages. A good first experiment in the Water Cycle & Watershed Simulator: Set impervious surface to 80% and rainfall to 40 mm/hr, then watch the hydrograph spike. The key relation to keep an eye on: P = ET + Q + ΔS; rational method Q = 0.278 C i A (m³/s; i in mm/h, A in km²).
For teachers: project the Water Cycle & Watershed Simulator on the board, let students predict the result, then run it together and test this: Compare the same rainfall on high permeability, 0% impervious land versus low permeability, 60% impervious land. For students: change one thing at a time and write down what changes.
Frequently asked questions
Why do cities flood more easily than forests in the same rainstorm?
Paved, impervious surfaces let almost all rainfall run off immediately instead of infiltrating into soil, so a city's watershed converts far more of a storm into fast runoff, producing a higher, faster streamflow peak than a forested watershed with the same rainfall.
If precipitation exceeds evapotranspiration, runoff and infiltration added together, where does the extra water go?
By mass balance it must be building up somewhere in the system as increased storage - as soil moisture, groundwater or a rising water table - which is exactly the ΔStorage term in the water balance equation.
Is the Water Cycle & Watershed Simulator free to use?
Yes. The Water Cycle & Watershed Simulator is free, needs no signup or download and runs in your web browser. It is part of the Environmental Science group of AZRS simulations.
Does the Water Cycle & Watershed Simulator work on a phone or tablet?
Yes. The Water Cycle & Watershed Simulator takes touch input as well as mouse input, so you can use its 5 adjustable settings with a finger. A larger screen makes the controls and graphs easier to read.