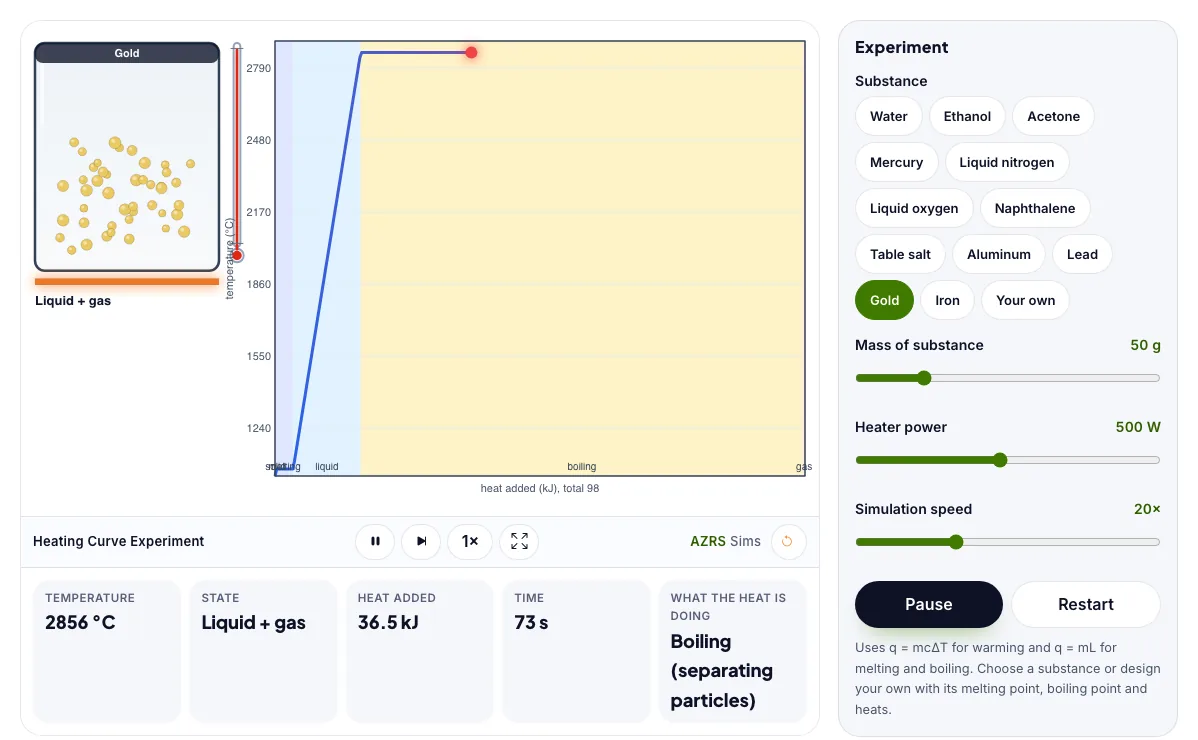
Heating Curve Experiment
Add heat to ice and watch temperature versus time, including the flat melting and boiling plateaus.
What the Heating Curve Experiment shows
Add heat to ice and watch temperature versus time, including the flat melting and boiling plateaus. Free, no signup, runs in your browser. Built for chemistry labs, the heating curve experiment runs instantly in your browser: change a setting or drag an object and the result updates at once, so you learn by trying things out rather than only reading about them.
Heat added to ice raises temperature, stops at melting and boiling, then continues.
How to use the Heating Curve Experiment
In the Heating Curve Experiment, use the controls to change Substance, Melting point, Boiling point, Liquid specific heat, Heat of fusion, and more. The simulation reacts instantly.
In the Heating Curve Experiment, pick an option such as Water, Ethanol, Acetone, Mercury to switch modes or load an example.
In the Heating Curve Experiment, press "Pause", "Restart" to start, reset or change what is happening.
Start with this experiment: Heat 50 g of ice to steam. Drag any glowing handle, object or slider with your mouse or finger and the Heating Curve Experiment responds in real time.
Change one setting at a time and watch which readout moves, then compare it with this idea: The temperature rises while heat warms a single phase (q = mcΔT).
Things to try
Heat 50 g of ice to steam.
Increase the mass and see the plateaus grow.
Change the heater power.
Find the energy needed for melting.
The science behind it
The temperature rises while heat warms a single phase (q = mcΔT).
During melting and boiling the temperature stays flat while heat breaks attractions (q = mL).
Boiling needs much more energy than melting because particles must fully separate.
A worked example with real numbers
Q = 100 x 334 = 33,400 J
Then to boil: 100 x 4.18 x 100 = 41,800 J
Then vaporize: 100 x 2260 = 226,000 J
Tips and common mistakes
Tips
- Notice the plateaus are the longest at boiling.
- The slope changes because c differs for ice, water, steam.
Common mistakes
- Thinking temperature rises during melting.
- Using the same specific heat for all phases.
Where this is used
Heating curves guide cooking, steam power, metal processing and climate science. Latent heat is why steam burns are so dangerous.
Who is this simulation for?
Students preparing for practical exams and teachers who want a virtual lab. A good first experiment in the Heating Curve Experiment: Heat 50 g of ice to steam. The key relation to keep an eye on: Q = m c delta T (heating); Q = m L (phase change); L_f = 334 J/g, L_v = 2260 J/g.
For teachers: project the Heating Curve Experiment on the board, let students predict the result, then run it together and test this: Increase the mass and see the plateaus grow. For students: change one thing at a time and write down what changes.
Frequently asked questions
Why does temperature stay flat while ice melts?
The added energy goes into breaking the bonds holding the solid together rather than speeding up particles, so temperature holds until all the ice has melted.
Why is the boiling plateau longer than the melting one?
The latent heat of vaporisation of water (2260 J/g) is about seven times bigger than the latent heat of fusion (334 J/g).
Is the Heating Curve Experiment free to use?
Yes. The Heating Curve Experiment is free, needs no signup or download and runs in your web browser. It is part of the Chemistry Labs group of AZRS simulations.
Does the Heating Curve Experiment work on a phone or tablet?
Yes. The Heating Curve Experiment takes touch input as well as mouse input, so you can use its 9 adjustable settings with a finger. A larger screen makes the controls and graphs easier to read.