Material Fatigue & S-N Curve Lab
Cycle a loaded part through repeated stress, watch the waveform run, and read off the S-N curve exactly how many cycles it should survive before it fails.
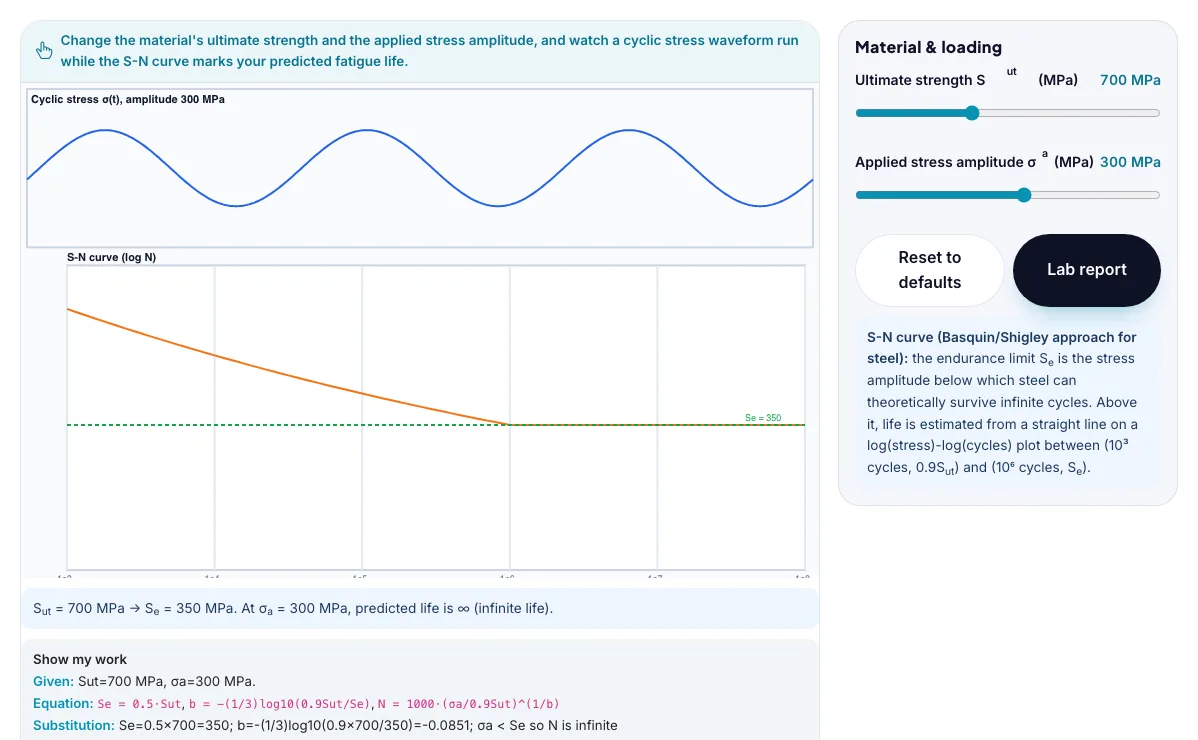
Change the material's ultimate strength and the applied stress amplitude, and watch a cyclic stress waveform run while the S-N curve marks your predicted fatigue life.
Se = 0.5·Sut, b = -(1/3)log10(0.9Sut/Se), N = 1000·(σa/0.9Sut)^(1/b)What the Material Fatigue & S-N Curve Lab shows
Cycle a loaded part through repeated stress, watch the waveform run, and read off the S-N curve exactly how many cycles it should survive before it fails. Built for engineering, the material fatigue & s-n curve lab runs instantly in your browser: change a setting or drag an object and the result updates at once, so you learn by trying things out rather than only reading about them.
An S-N (stress versus cycles) curve for a metal. You set the ultimate strength and the stress amplitude and read the predicted life in cycles.
How to use the Material Fatigue & S-N Curve Lab
In the Material Fatigue & S-N Curve Lab, use the controls to change Ultimate strength Sut (MPa), Applied stress amplitude σa (MPa). The simulation reacts instantly.
Start with this experiment: Try the 100,000-cycle life challenge at the default 700 MPa steel. Drag any glowing handle, object or slider with your mouse or finger and the Material Fatigue & S-N Curve Lab responds in real time.
Change one setting at a time and watch which readout moves, then compare it with this idea: Repeated cyclic stress can crack and break a part at a stress far below what would fail it in a single static pull - this is fatigue failure.
Things to try
Try the 100,000-cycle life challenge at the default 700 MPa steel.
Drop the stress amplitude below the endurance limit and confirm the infinite-life challenge passes.
Raise Sut to 1000 MPa and see how much longer the same stress amplitude survives.
Watch the red dot on the S-N curve slide as you drag the stress amplitude slider.
The science behind it
Repeated cyclic stress can crack and break a part at a stress far below what would fail it in a single static pull - this is fatigue failure.
The endurance limit Se is the stress amplitude below which steel can theoretically survive infinite cycles; for many steels Se is about half the ultimate strength Sut.
Above the endurance limit, the S-N curve (Basquin's equation) draws a straight line on log(stress) vs log(cycles) axes between (10^3 cycles, 0.9Sut) and (10^6 cycles, Se), letting you read off predicted life N for any stress amplitude.
Because the S-N relationship is a power law, even a modest reduction in stress amplitude can multiply the predicted fatigue life by a large factor.
A worked example with real numbers
a = (f Sut)² / Sₑ = (540)² / 300 = 972 MPa
b = −(1/3) log₁₀(f Sut / Sₑ) = −(1/3) log₁₀(1.8) = −0.085
N = (σₐ / a)^(1/b) = (400 / 972)^(−11.8) ≈ 3.4 × 10⁴ cycles
Below 300 MPa the steel is predicted to last indefinitely.
Tips and common mistakes
Tips
- Reduce the stress amplitude a little and see the life rise steeply.
- Compare the high-cycle region with the low-cycle region of the curve.
- Remember that the chart is logarithmic; small moves mean big changes in life.
Common mistakes
- Fatigue depends on the stress amplitude, not just the peak stress.
- Only some materials (steels) show a true endurance limit; aluminium does not.
- Surface finish, size and corrosion lower real endurance limits.
Where this is used
Engineers run this exact S-N/endurance-limit check on rotating shafts, aircraft components, bridge connections and any part under repeated cyclic loading, since fatigue - not one-time overload - is the most common cause of mechanical failure in service.
Who is this simulation for?
Engineering and technology students, makers, robotics clubs and teachers of design and technology. A good first experiment in the Material Fatigue & S-N Curve Lab: Try the 100,000-cycle life challenge at the default 700 MPa steel. The key relation to keep an eye on: Textbook estimate: endurance limit Sₑ ≈ 0.5 Sut for steels; Basquin form σₐ = a N^b.
For teachers: project the Material Fatigue & S-N Curve Lab on the board, let students predict the result, then run it together and test this: Drop the stress amplitude below the endurance limit and confirm the infinite-life challenge passes. For students: change one thing at a time and write down what changes.
Frequently asked questions
Why can a part fail from fatigue at a stress far below its ultimate strength?
Fatigue failure is driven by microscopic cracks that form and slowly grow at points of repeated cyclic stress, not by the material yielding all at once; each cycle grows the crack a little further until it is large enough to fracture suddenly, which can happen at stress amplitudes well below the one-time ultimate strength.
Why does lowering the stress amplitude below the endurance limit give theoretically infinite life instead of just a longer one?
For many steels the S-N curve flattens out into a horizontal line at the endurance limit Se; below that stress the microscopic damage per cycle is too small to ever grow into a propagating crack, so the Basquin power-law relationship no longer applies and the part can in theory be cycled forever.
Is the Material Fatigue & S-N Curve Lab free to use?
Yes. The Material Fatigue & S-N Curve Lab is free, needs no signup or download and runs in your web browser. It is part of the Engineering group of AZRS simulations.
Does the Material Fatigue & S-N Curve Lab work on a phone or tablet?
Yes. The Material Fatigue & S-N Curve Lab takes touch input as well as mouse input, so you can use its 2 adjustable settings with a finger. A larger screen makes the controls and graphs easier to read.