Periodic Trends Explorer
Colour the periodic table by radius, electronegativity or ionisation energy and see the trends.
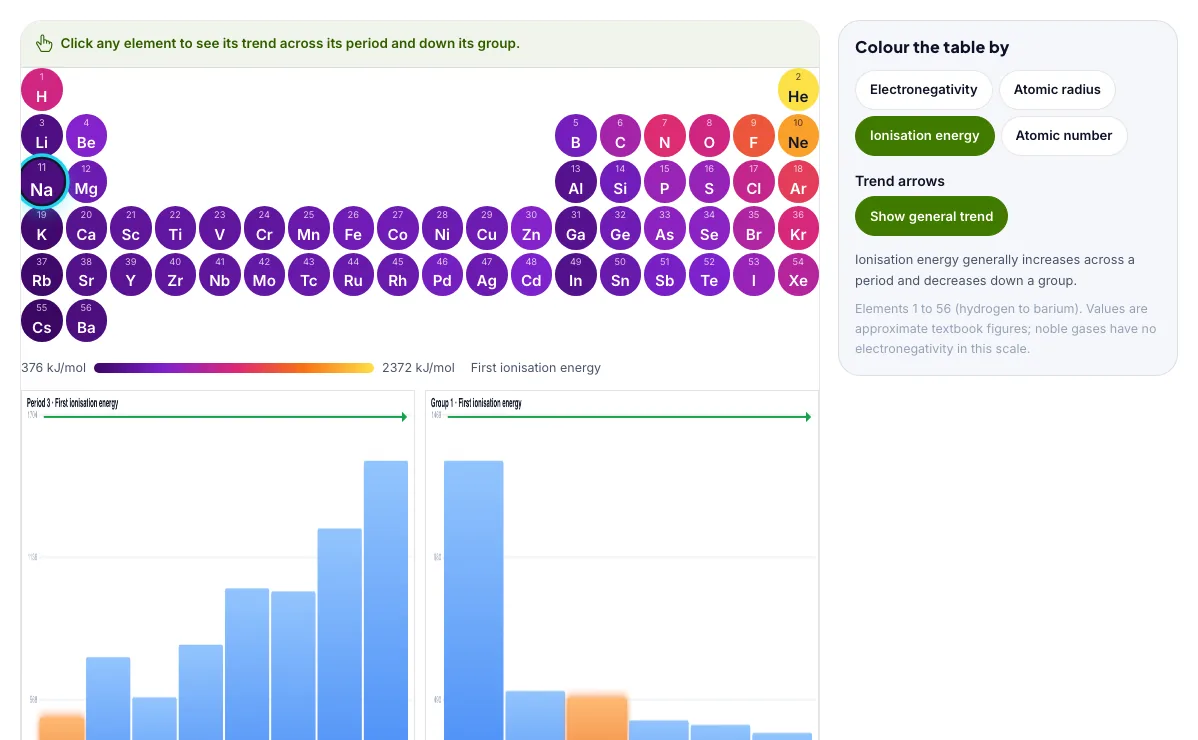
Click any element to see its trend across its period and down its group.
What the Periodic Trends Explorer shows
Colour the periodic table by radius, electronegativity or ionisation energy and see the trends. Free, no signup, runs in your browser. Built for chemistry, the periodic trends explorer runs instantly in your browser: change a setting or drag an object and the result updates at once, so you learn by trying things out rather than only reading about them.
The periodic table coloured by electronegativity, radius, ionisation energy or atomic number, with trend arrows.
How to use the Periodic Trends Explorer
In the Periodic Trends Explorer, use the controls to change Trend arrows. The simulation reacts instantly.
In the Periodic Trends Explorer, pick an option such as Electronegativity, Atomic radius, Ionisation energy, Atomic number to switch modes or load an example.
Start with this experiment: Colour by electronegativity and find the top-right corner. Drag any glowing handle, object or slider with your mouse or finger and the Periodic Trends Explorer responds in real time.
Change one setting at a time and watch which readout moves, then compare it with this idea: Atomic radius decreases across a period and increases down a group.
Things to try
Colour by electronegativity and find the top-right corner.
Switch to atomic radius and compare Li and F.
Click an element to read its numbers.
Find the alkali metal with the lowest ionisation energy.
The science behind it
Atomic radius decreases across a period and increases down a group.
Electronegativity and ionisation energy increase across a period and decrease down a group.
Noble gases have very high ionisation energies because their shells are full.
A worked example with real numbers
Na: S = 8 × 0.85 + 2 × 1.00 = 8.8, Zeff = 2.2
Cl: S = 6 × 0.35 + 8 × 0.85 + 2 × 1.00 = 10.9, Zeff = 6.1
Cl pulls harder, so it is smaller with a higher ionisation energy.
Tips and common mistakes
Tips
- Switch between properties and see the same left–right pattern.
- Watch the exceptions across a period.
- Compare group trends going down.
Common mistakes
- Radius shrinks across a period because Zeff rises.
- More shells do not always mean weaker pull; they shield.
- Noble gases lack electronegativity values.
Where this is used
Chemists use periodic trends to predict bond types, reactivity, and which elements make good conductors, batteries and catalysts.
Who is this simulation for?
Chemistry students from middle school to university, teachers who need a virtual demonstration, and anyone without access to a lab. A good first experiment in the Periodic Trends Explorer: Colour by electronegativity and find the top-right corner. The key relation to keep an eye on: Effective nuclear charge Zeff = Z − S (S from Slater's rules).
For teachers: project the Periodic Trends Explorer on the board, let students predict the result, then run it together and test this: Switch to atomic radius and compare Li and F. For students: change one thing at a time and write down what changes.
Frequently asked questions
Why does atomic radius get smaller across a period?
The nuclear charge increases while electrons are added to the same shell, so the nucleus pulls the electron cloud in more tightly.
Which element is the most electronegative?
Fluorine, with an electronegativity of 3.98 on the Pauling scale.
Is the Periodic Trends Explorer free to use?
Yes. The Periodic Trends Explorer is free, needs no signup or download and runs in your web browser. It is part of the Chemistry group of AZRS simulations.
Does the Periodic Trends Explorer work on a phone or tablet?
Yes. The Periodic Trends Explorer takes touch input as well as mouse input, so you can use its 1 adjustable settings with a finger. A larger screen makes the controls and graphs easier to read.