
Meet the Stock Analysis
Type a ticker such as AAPL, MSFT or NVDA and this tool builds a single 0-100 score from four parts: fundamentals, technicals, sentiment and risk. Each part has its own sub-score, so you can
- Free to use
- No signup
- Nothing to install
- Works in any modern browser
 Your input
 The action
A real example, step by step
Real data entered into the Stock Analysis, one screenshot per step. Nothing is mocked up.
Open the tool
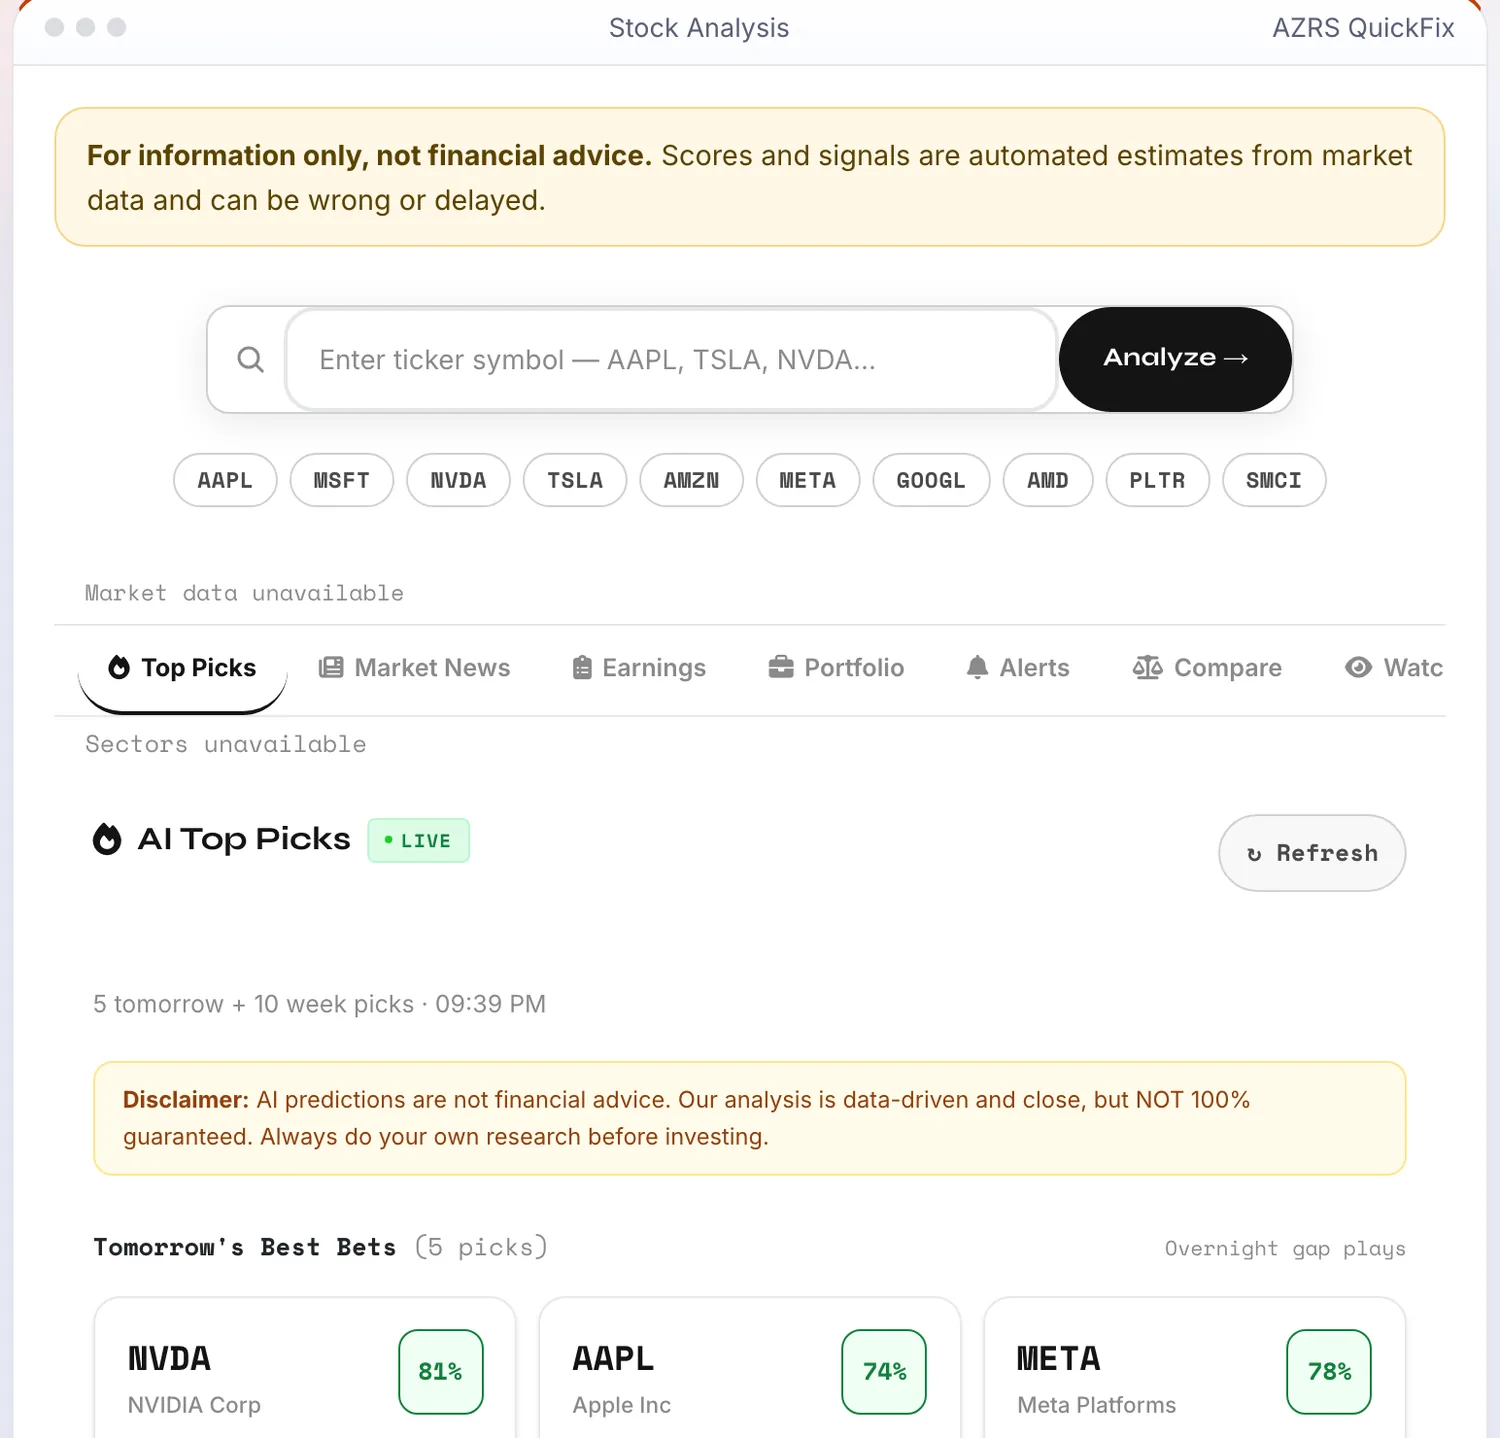
The Stock Analysis opens ready to use, nothing to install or sign up for.
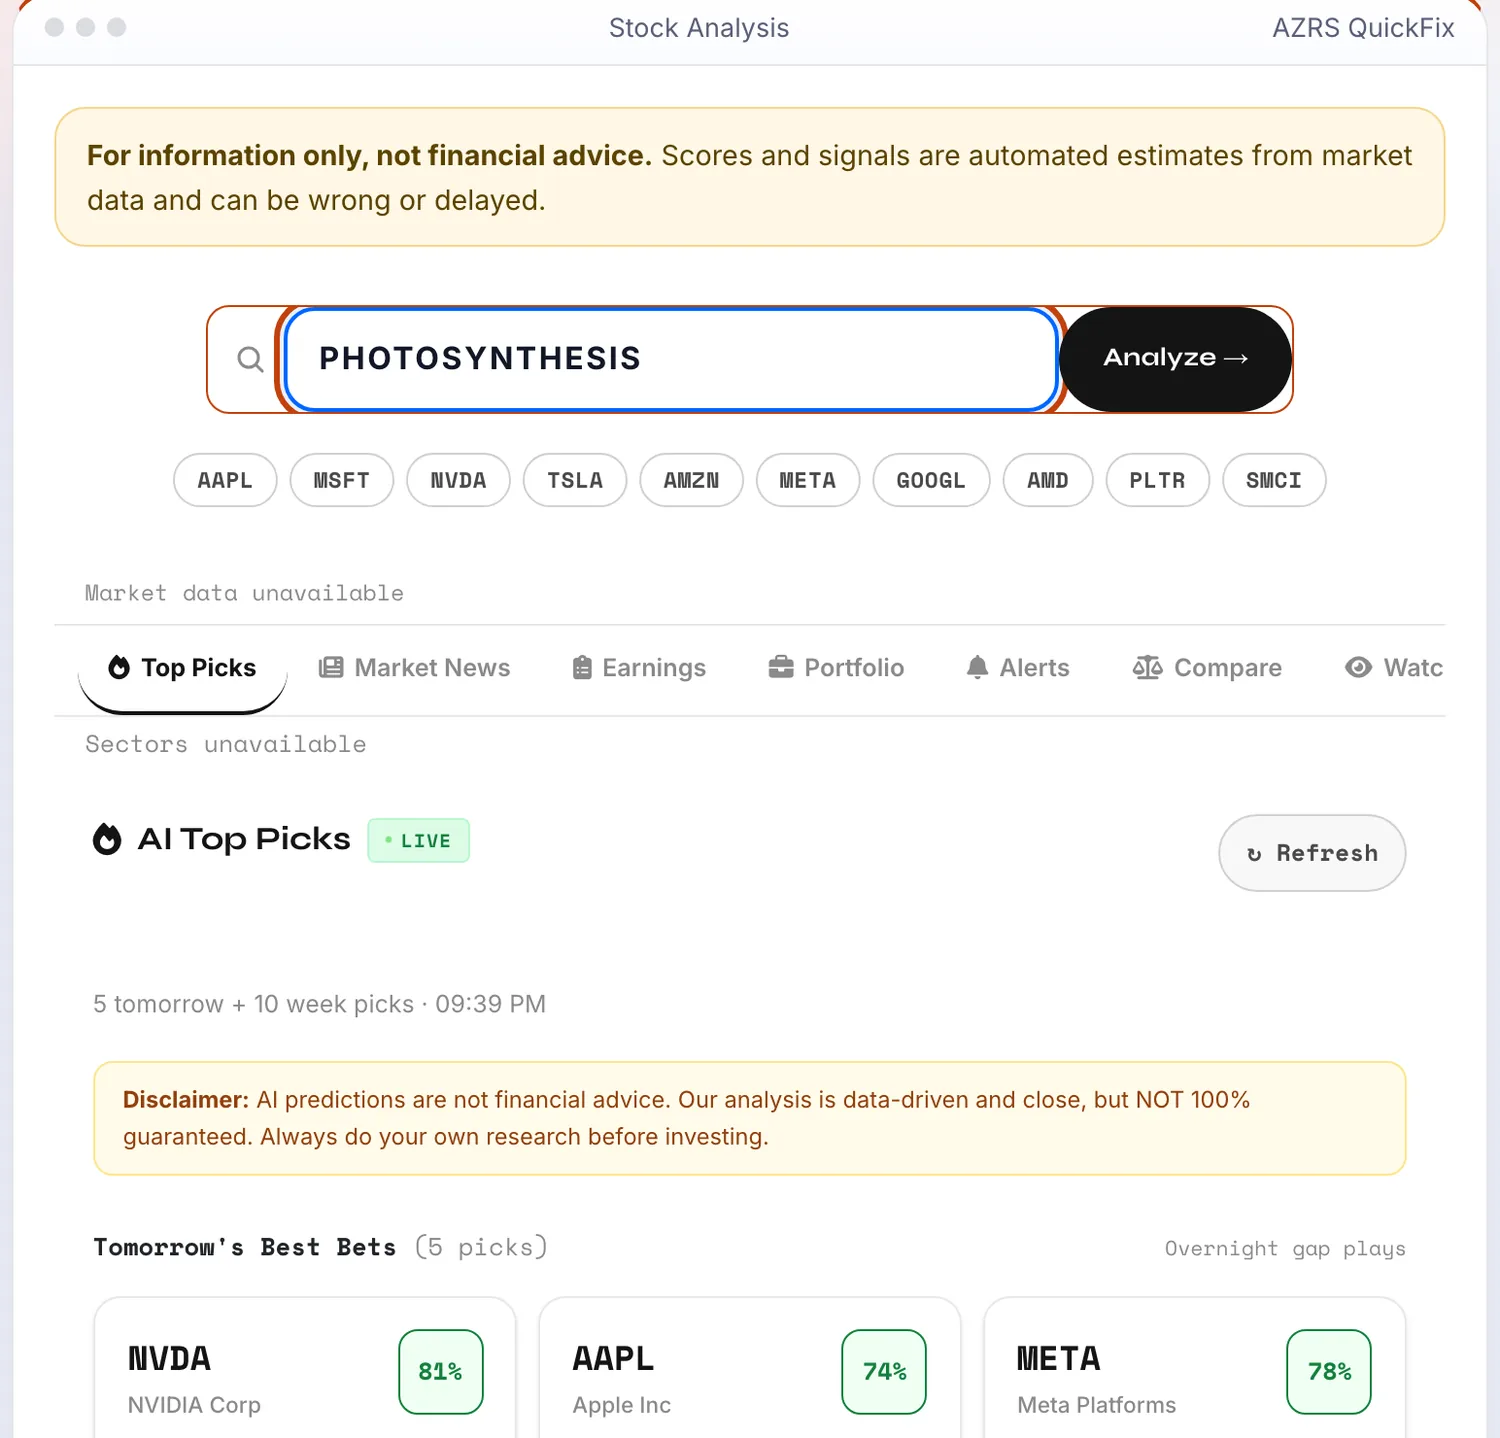
Enter your data
Real input used here: Enter ticker symbol — AAPL, TSLA, NVDA... photosynthesis.
See the result
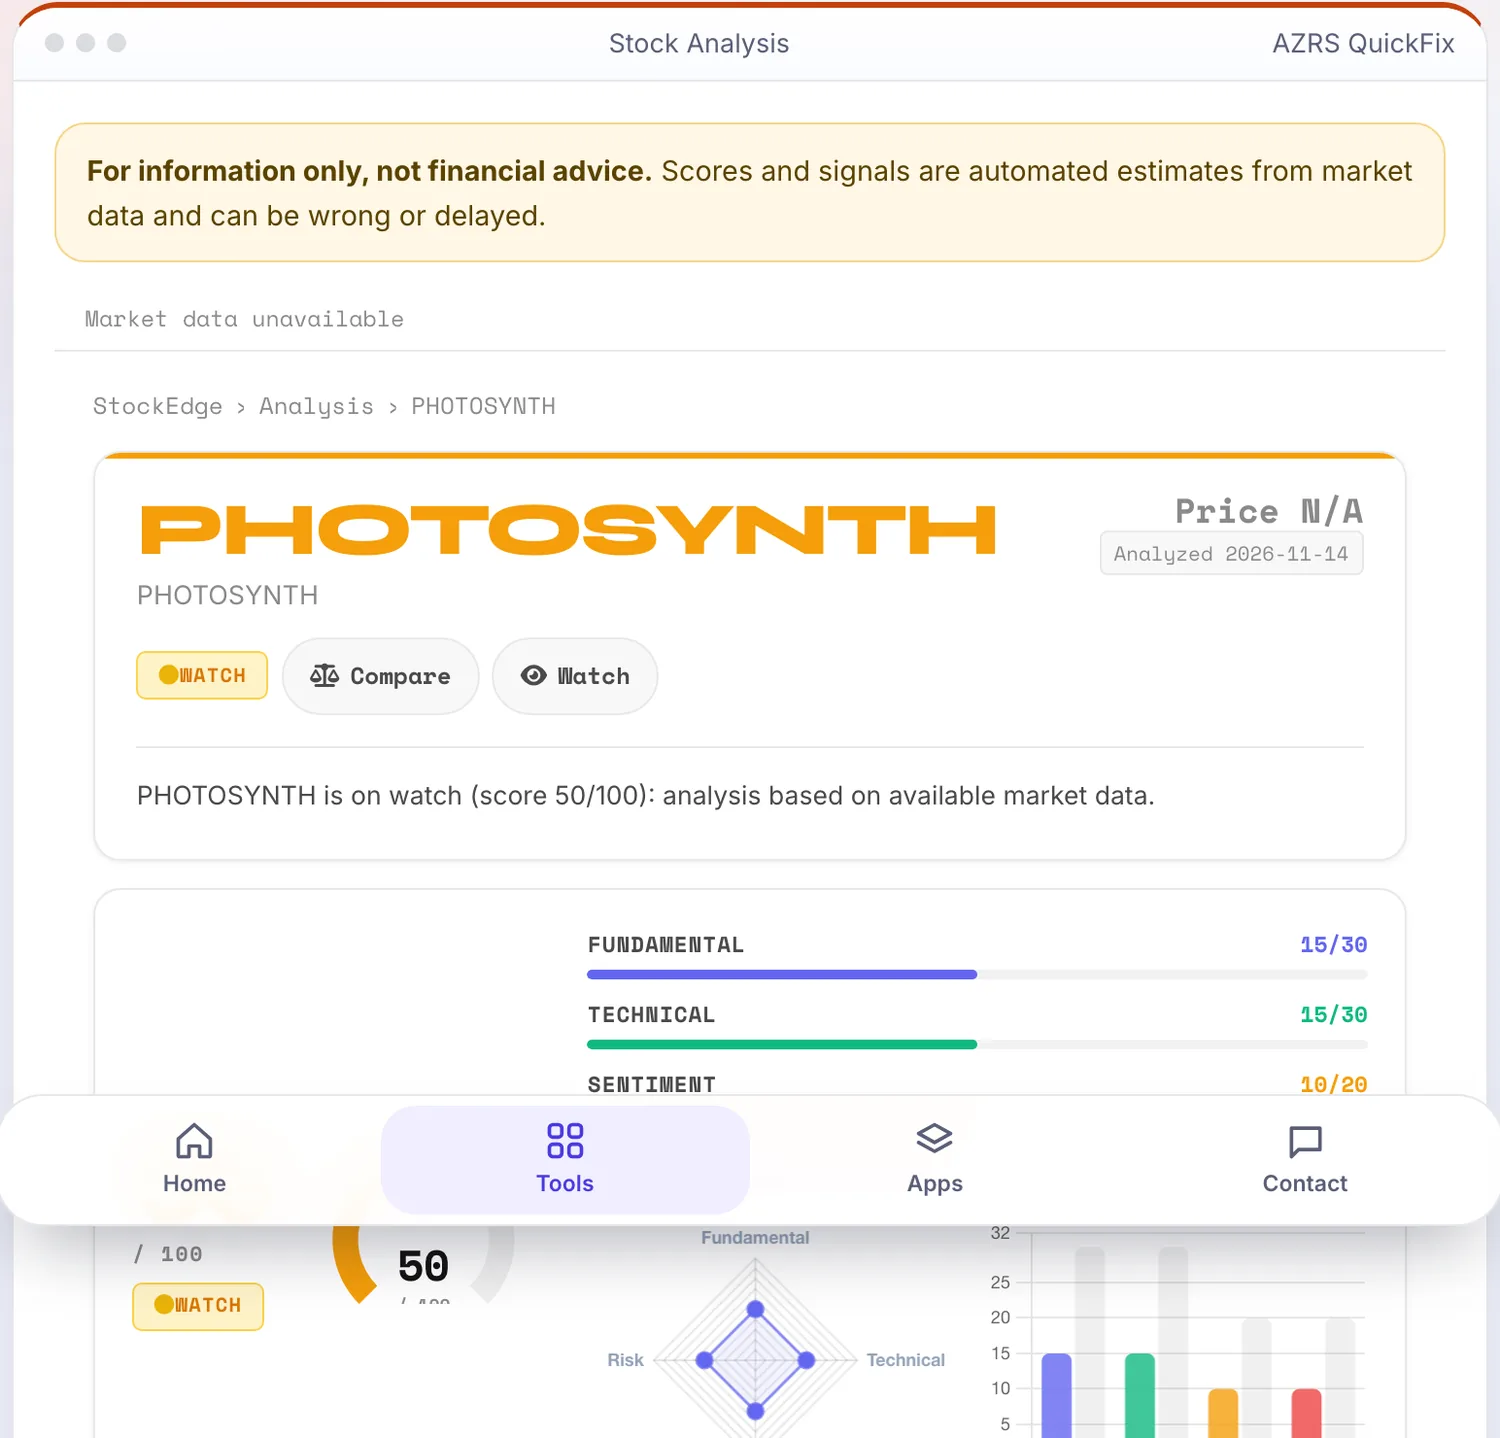
The result appears on the same page.
What is the Stock Analysis?
Type a ticker such as AAPL, MSFT or NVDA and this tool builds a single 0-100 score from four parts: fundamentals, technicals, sentiment and risk. Each part has its own sub-score, so you can see at a glance whether a stock looks strong on the numbers, strong on the chart, or just popular in the news.
The output is an automated estimate from market data and is for information only, not financial advice. Data can be delayed or incomplete, and a high score is not a prediction that the price will rise.
3 steps to your result
Open the tool and follow along. Nothing to install.
What you get
A total out of 100 split into fundamentals (out of 30), technicals (out of 30), sentiment (out of 20) and risk (out of 20), shown as bars so you can see what drives the total.
Price, market cap, P/E, PEG, RSI and moving averages next to the score, so you do not need five tabs.
Add a stock to your watchlist or compare it with another ticker from the same page.
A market bar, news and earnings tabs on the home page show what the wider market is doing.
AZRS tools are free to open and use.
It opens in your browser, so there is nothing to download.
Used for
Pick one to see how it fits.
New investors
Get a plain-English first look at a ticker before reading full reports.
Try it freeStudents
See how fundamentals, technicals and sentiment are weighed against each other.
Try it freeBusy investors
Screen several tickers quickly, then dig into the ones that stand out.
Try it freeHow it compares
A plain look at this tool next to the usual alternative.
| This calculator | Desktop software | |
|---|---|---|
| Install | Nothing to install | Usually an app or program to install |
| Account | No signup | Depends on the product |
| Cost | Free to use | Free or paid, depends on the product |
Questions people ask
Is this financial advice?
No. It is an automated estimate from market data, for information only. Markets move for reasons no score can capture, so do your own research or ask a licensed adviser.
How is the total score built?
It adds four parts: fundamentals out of 30, technicals out of 30, sentiment out of 20 and risk out of 20, for a maximum of 100.
Is the price live?
Prices come from a market data provider and can be delayed. The result shows the date it was analysed.
Do I need an account?
No account is needed to look up a ticker. Watchlist and portfolio features keep data in your browser unless you sign in.
Why does a ticker fail to load?
The symbol may be misspelled, delisted, or the data provider may be temporarily unavailable. Try the exact exchange symbol and retry in a minute.
More free tools
Related to the Stock Analysis.
Try the Stock Analysis now
Type a ticker such as AAPL, MSFT or NVDA and this tool builds a single 0-100 score from. Free to use.
Try it free