
Try the Statistics Calculator
Calculate mean, median, mode, range, variance, standard deviation, quartiles and IQR for any data set. Paste numbers separated by commas, spaces or lines.
- Free to use
- No signup
- Nothing to install
- Runs in your browser
Illustration. Open the tool for the real thing.
See it in action
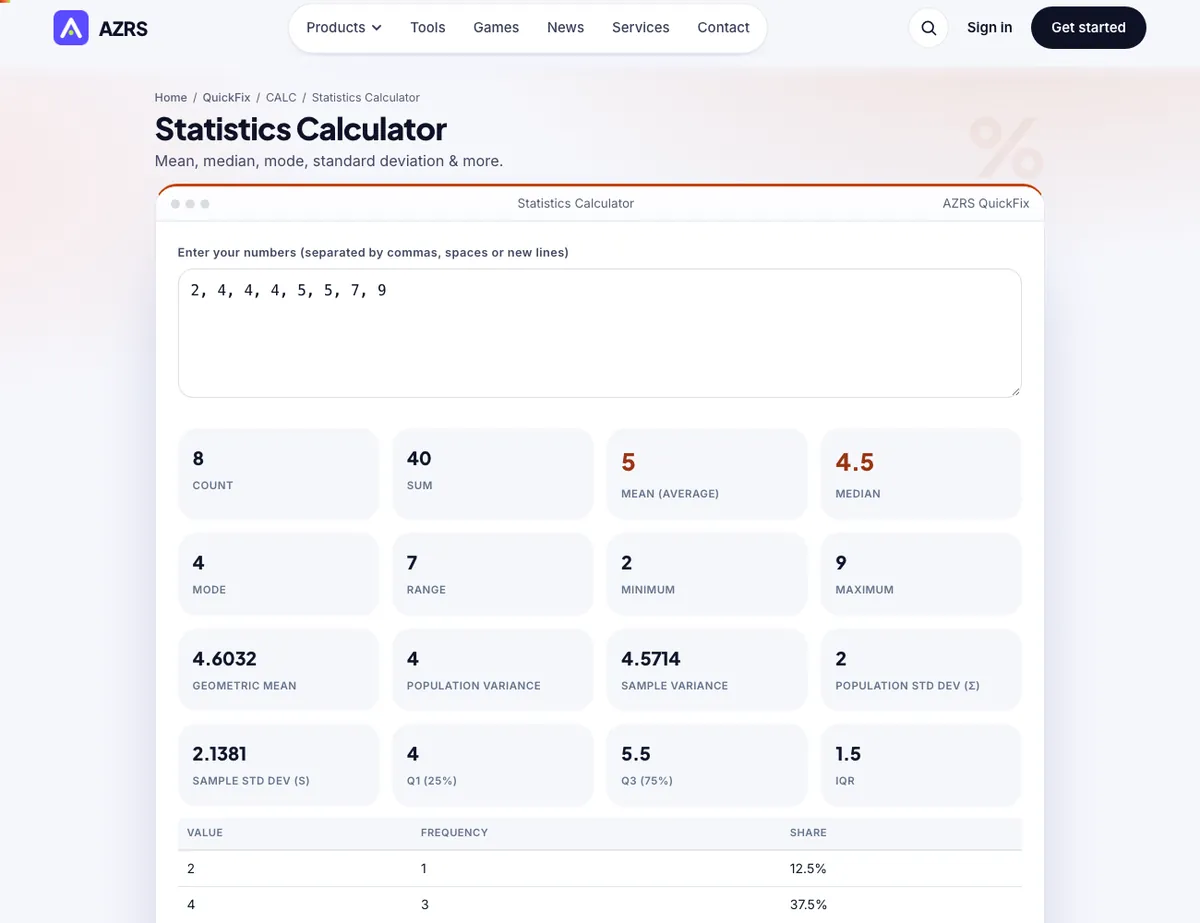
The Statistics Calculator with sample data entered and the result showing.
What is the Statistics Calculator?
This statistics calculator summarises a list of numbers in one click. Paste or type your data, separated by commas, spaces or new lines, and it instantly returns the count, sum, mean (average), median, mode, range, minimum and maximum, sample and population variance and standard deviation, quartiles and the interquartile range (IQR).
It shows the working values and the sorted data so you can check homework or sense-check a report, and it handles decimals and negative numbers. Choose between sample and population formulas — the correct one depends on whether your data is the whole group or just a sample of it.
3 steps to your result
Open the tool and follow along. Nothing to install.
What you get
Mean, median, mode, range, variance, standard deviation and quartiles.
Both standard deviation formulas are shown side by side.
Comma, space or line separated; decimals and negatives allowed.
See the ordered list and frequency of each value.
AZRS tools are free to open and use.
It opens in your browser, so there is nothing to download.
Used for
Pick one to see how it fits.
Analysts and researchers
Get quick descriptive statistics without opening a spreadsheet.
Try it freeHow it compares
A plain look at this tool next to the usual alternative.
| This calculator | Desktop software | |
|---|---|---|
| Install | Nothing to install | Usually an app or program to install |
| Account | No signup | Depends on the product |
| Cost | Free to use | Free or paid, depends on the product |
| Where it runs | In your browser tab | On your computer |
Questions people ask
What is the difference between mean, median and mode?
Mean is the average, median is the middle value when sorted, and mode is the most frequent value.
When do I use sample standard deviation?
When your numbers are a sample of a bigger group; it divides by n−1 instead of n.
What is the IQR?
The interquartile range is Q3 minus Q1 — the spread of the middle 50% of the data.
Can there be more than one mode?
Yes. If several values tie for most frequent, all are listed.
Does it handle negative numbers and decimals?
Yes.
More free tools
Related to the Statistics Calculator.
Try the Statistics Calculator now
Mean, median, mode, standard deviation & more. Free to use.
Try it free