
Explore the Solubility Curve Explorer
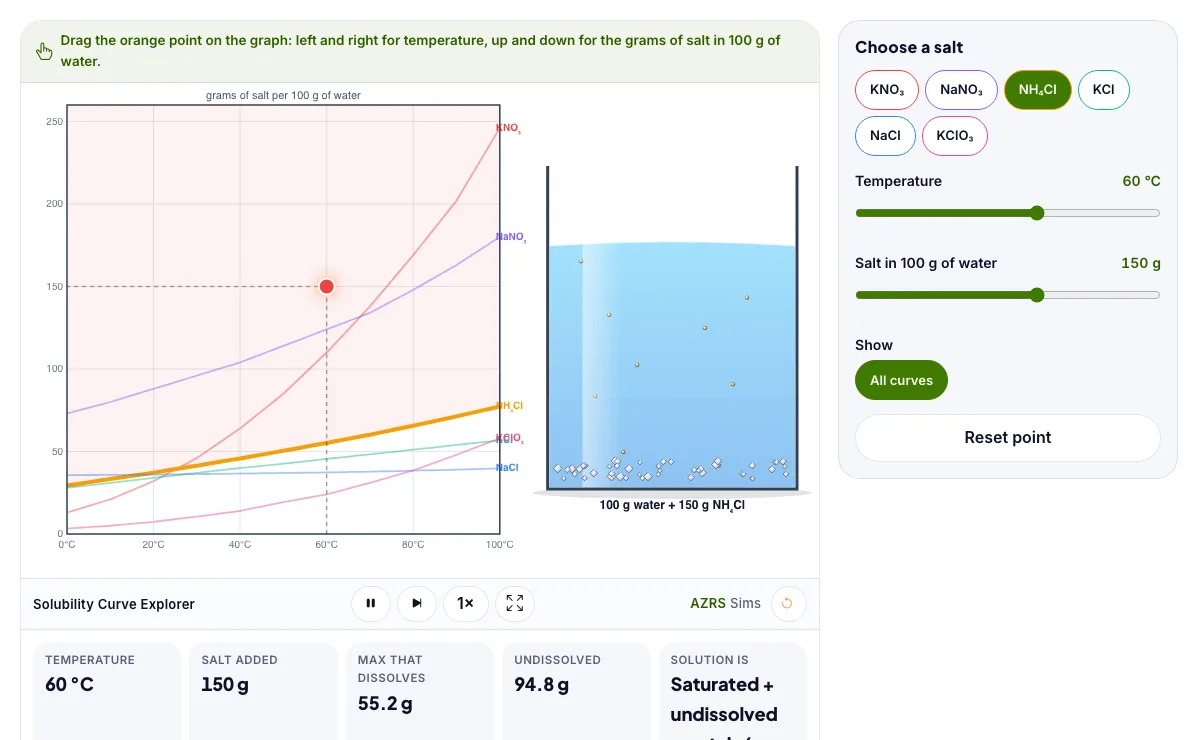
Drag a point on the solubility graph and see whether the solution is unsaturated, saturated or super-saturated. Free, no signup, runs in your browser.
- Free to use
- No signup
- Nothing to install
- Runs in your browser
Illustration. Open the tool for the real thing.
See it in action
The Solubility Curve Explorer with sample data entered and the result showing.
What is the Solubility Curve Explorer?
Drag a point on the solubility graph and see whether the solution is unsaturated, saturated or super-saturated. It runs in your browser, so a change to a setting or a drag on an object shows up at once.
Sugar makers, chemists purifying salts by crystallisation, and aquarium keepers all rely on solubility. It also explains why fizzy drinks go flat when warm.
3 steps to your result
Open the tool and follow along. Nothing to install.
What you get
A solubility curve shows how many grams dissolve in 100 g of water at each temperature.
Points on the curve are saturated, below it unsaturated, above it there is undissolved solute (or a super-saturated solution).
Most solids dissolve better when hot, but some salts like NaCl barely change.
Put 60 g of KNO₃ in the beaker at 20 °C, then heat it.
Compare NaCl and KNO₃ at 80 °C.
Cool a saturated solution and watch crystals form.
Used for
Pick one to see how it fits.
Chemistry learners
Chemistry students from middle school to university, teachers who need a virtual demonstration, and anyone without access to a lab.
Try it freeTeachers
For teachers: project the Solubility Curve Explorer on the board, let students predict the result, then run it together and test this: Compare NaCl and KNO₃ at 80 °C. For students: change one thing at a time and write down what changes.
Try it freeHow it compares
A plain look at this tool next to the usual alternative.
| This simulation | Textbook diagram | |
|---|---|---|
| Interactive | Drag, tap and change settings | Fixed picture |
| Install | Nothing to install | Not needed |
| Cost | Free to use | Depends on the book |
Questions people ask
What does a solubility curve show?
The maximum mass of a solute that dissolves in 100 g of water at each temperature. Below the line more can still dissolve.
What is a super-saturated solution?
A solution holding more solute than the curve allows. It is unstable and crystals can suddenly form.
Is the Solubility Curve Explorer free to use?
Yes. The Solubility Curve Explorer is free, needs no signup or download and runs in your web browser. It is part of the Chemistry group of AZRS simulations.
Does the Solubility Curve Explorer work on a phone or tablet?
Yes. The Solubility Curve Explorer takes touch input as well as mouse input, so you can use its 2 adjustable settings with a finger. A larger screen makes the controls and graphs easier to read.
How do I use the Solubility Curve Explorer?
1. In the Solubility Curve Explorer, use the controls to change Temperature, Salt in 100 g of water. The simulation reacts instantly. 2. In the Solubility Curve Explorer, pick an option such as All curves to switch modes or load an example. 3. In the Solubility Curve Explorer, press "Reset point" to start, reset or change what is happening. 4. Start with this experiment: Put 60 g of KNO₃ in the beaker at 20 °C, then heat it. Drag any glowing handle, object or slider with your mouse or finger and the Solubility Curve Explorer responds in real time. 5. Change one setting at a time and watch which readout moves, then compare it with this idea: A solubility curve shows how many grams dissolve in 100 g of water at each temperature.
More free tools
Related to the Solubility Curve Explorer.
Try the Solubility Curve Explorer now
Drag a point on the solubility graph and see whether the solution is unsaturated. Free to use.
Try it free