
Explore the Integral & Area Under Curve
Drag the limits, choose the number of rectangles and compare Riemann sums with the exact area. Free, no signup, runs in your browser.
- Free to use
- No signup
- Nothing to install
- Runs in your browser
Illustration. Open the tool for the real thing.
See it in action
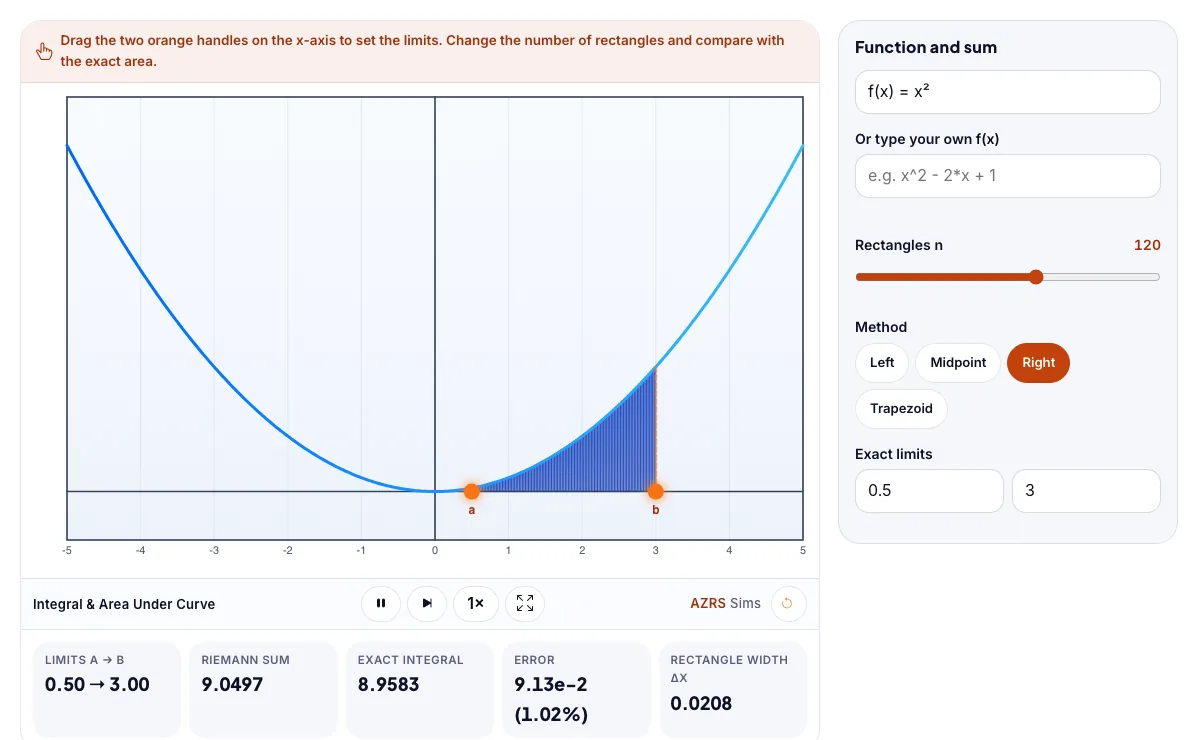
The Integral & Area Under Curve with sample data entered and the result showing.
What is the Integral & Area Under Curve?
Drag the limits, choose the number of rectangles and compare Riemann sums with the exact area. It runs in your browser, so a change to a setting or a drag on an object shows up at once.
Integrals compute distance from speed, work from force, probabilities and areas, and are used across engineering and science.
3 steps to your result
Open the tool and follow along. Nothing to install.
What you get
A definite integral is the signed area between the curve and the x-axis.
Riemann sums approximate the area with rectangles. More rectangles gives a better answer.
Midpoint sums are usually more accurate than left or right sums.
Drag the upper limit and watch the area update.
Increase the rectangles from 4 to 100 and see the error shrink.
Compare left, right and midpoint sums for the same n.
Used for
Pick one to see how it fits.
Math learners
Algebra, geometry, trigonometry and calculus students, teachers preparing demonstrations, and self-learners who want to see the maths move.
Try it freeTeachers
For teachers: project the Integral & Area Under Curve on the board, let students predict the result, then run it together and test this: Increase the rectangles from 4 to 100 and see the error shrink. For students: change one thing at a time and write down what changes.
Try it freeHow it compares
A plain look at this tool next to the usual alternative.
| This simulation | Textbook diagram | |
|---|---|---|
| Interactive | Drag, tap and change settings | Fixed picture |
| Install | Nothing to install | Not needed |
| Cost | Free to use | Depends on the book |
Questions people ask
What is a Riemann sum?
An approximation of the area under a curve by adding up the areas of thin rectangles. As the rectangles get thinner the sum approaches the exact integral.
Why can an integral be negative?
Area below the x-axis counts as negative, so the integral is the area above minus the area below.
Is the Integral & Area Under Curve free to use?
Yes. The Integral & Area Under Curve is free, needs no signup or download and runs in your web browser. It is part of the Math group of AZRS simulations.
Does the Integral & Area Under Curve work on a phone or tablet?
Yes. The Integral & Area Under Curve takes touch input as well as mouse input, so you can use its 4 adjustable settings with a finger. A larger screen makes the controls and graphs easier to read.
How do I use the Integral & Area Under Curve?
1. In the Integral & Area Under Curve, use the controls to change Or type your own f(x), Rectangles n, Method, Exact limits. The simulation reacts instantly. 2. In the Integral & Area Under Curve, pick an option such as Left, Midpoint, Right, Trapezoid to switch modes or load an example. 3. Start with this experiment: Drag the upper limit and watch the area update. Drag any glowing handle, object or slider with your mouse or finger and the Integral & Area Under Curve responds in real time. 4. Change one setting at a time and watch which readout moves, then compare it with this idea: A definite integral is the signed area between the curve and the x-axis.
More free tools
Related to the Integral & Area Under Curve.
Try the Integral & Area Under Curve now
Drag the limits, choose the number of rectangles and compare Riemann sums with the exact. Free to use.
Try it free