
Explore the Free Fall & Motion Graphs
Drop or throw an object and watch position and velocity graphs build in real time. Free, no signup, runs in your browser.
- Free to use
- No signup
- Nothing to install
- Runs in your browser
Illustration. Open the tool for the real thing.
See it in action
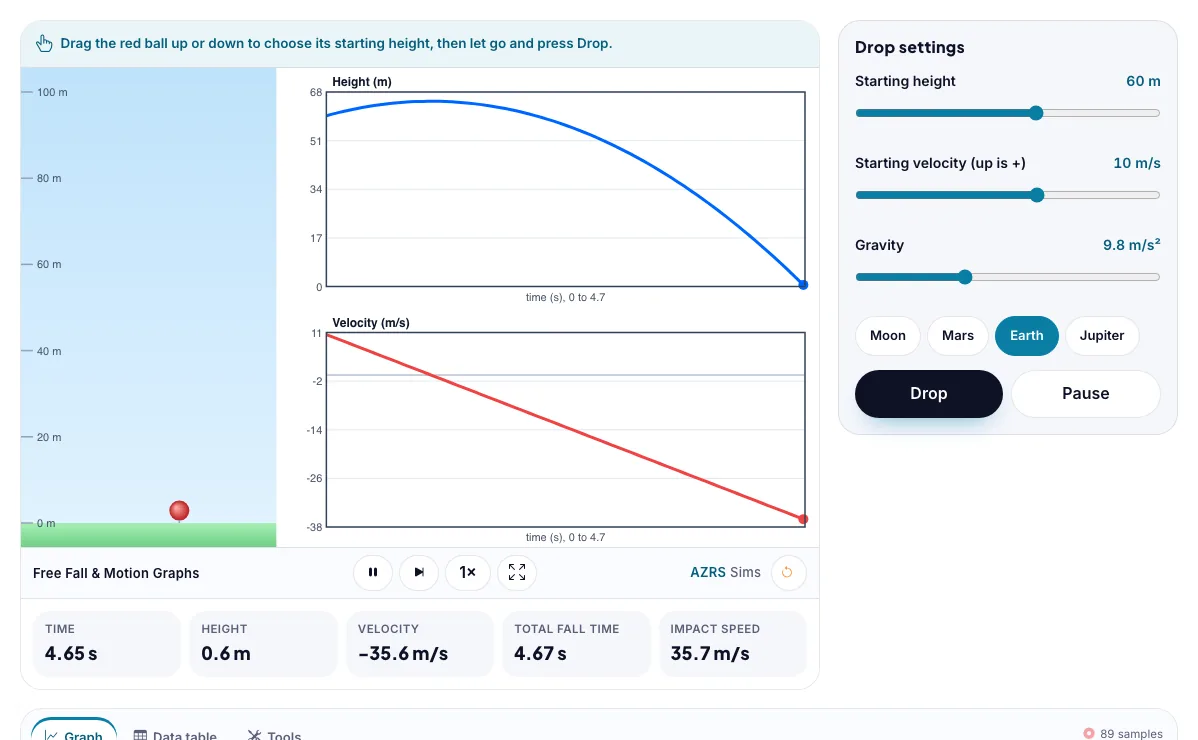
The Free Fall & Motion Graphs with sample data entered and the result showing.
What is the Free Fall & Motion Graphs?
Drop or throw an object and watch position and velocity graphs build in real time. It runs in your browser, so a change to a setting or a drag on an object shows up at once.
Free fall is the basis of skydiving physics, drop-tower rides, crash tests and the design of parachutes and space capsules.
3 steps to your result
Open the tool and follow along. Nothing to install.
What you get
Under gravity alone, velocity changes by g every second, so the velocity-time graph is a straight line.
The position-time graph of free fall is a parabola.
Fall time from rest is t = √(2h / g), and it does not depend on mass.
Drop from 50 m and read the fall time.
Throw upward at 15 m/s and find the peak.
Switch to the Moon.
Used for
Pick one to see how it fits.
Physics learners
Physics students in middle school, high school and first-year university, teachers who want a quick demonstration for the projector, and anyone revising for exams.
Try it freeTeachers
For teachers: project the Free Fall & Motion Graphs on the board, let students predict the result, then run it together and test this: Throw upward at 15 m/s and find the peak. For students: change one thing at a time and write down what changes.
Try it freeHow it compares
A plain look at this tool next to the usual alternative.
| This simulation | Textbook diagram | |
|---|---|---|
| Interactive | Drag, tap and change settings | Fixed picture |
| Install | Nothing to install | Not needed |
| Cost | Free to use | Depends on the book |
Questions people ask
Do heavier objects fall faster?
Not without air resistance. All objects accelerate at the same rate g, so a heavy and a light object dropped together land together.
What does the slope of a velocity-time graph mean?
The slope is acceleration. In free fall it is constant and equal to g.
Is the Free Fall & Motion Graphs free to use?
Yes. The Free Fall & Motion Graphs is free, needs no signup or download and runs in your web browser. It is part of the Physics group of AZRS simulations.
Does the Free Fall & Motion Graphs work on a phone or tablet?
Yes. The Free Fall & Motion Graphs takes touch input as well as mouse input, so you can use its 3 adjustable settings with a finger. A larger screen makes the controls and graphs easier to read.
How do I use the Free Fall & Motion Graphs?
1. In the Free Fall & Motion Graphs, use the controls to change Starting height, Starting velocity (up is +), Gravity. The simulation reacts instantly. 2. In the Free Fall & Motion Graphs, pick an option such as Moon, Mars, Earth, Jupiter to switch modes or load an example. 3. In the Free Fall & Motion Graphs, press "Drop", "Pause" to start, reset or change what is happening. 4. Start with this experiment: Drop from 50 m and read the fall time. Drag any glowing handle, object or slider with your mouse or finger and the Free Fall & Motion Graphs responds in real time. 5. Change one setting at a time and watch which readout moves, then compare it with this idea: Under gravity alone, velocity changes by g every second, so the velocity-time graph is a straight line.
More free tools
Related to the Free Fall & Motion Graphs.
Try the Free Fall & Motion Graphs now
Drop or throw an object and watch position and velocity graphs build in real time. Free to use.
Try it free